
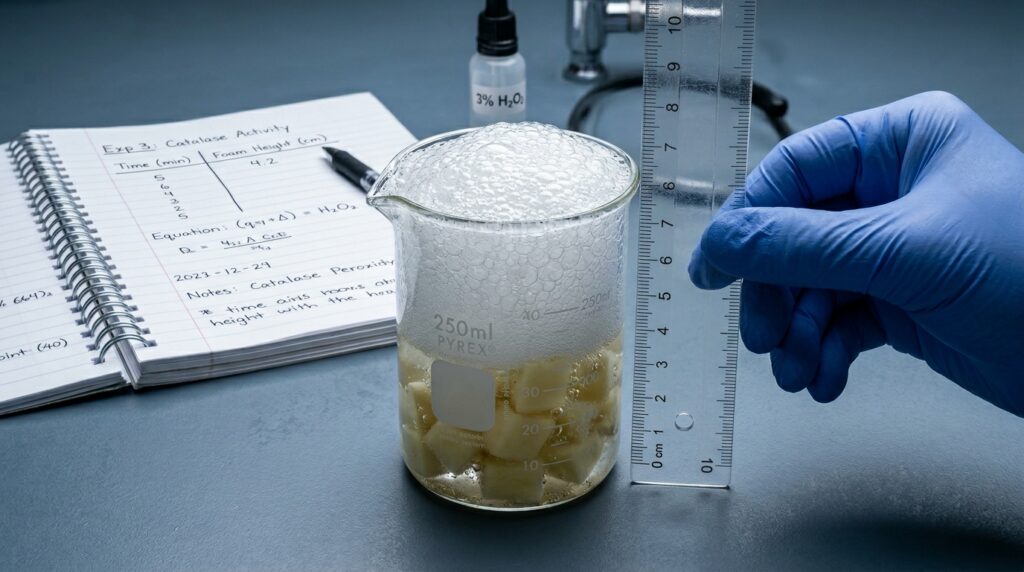
When I was in high school, my biology lab partner and I spent an entire afternoon conducting an experiment on enzyme activity using raw potato cubes and hydrogen peroxide. We were supposed to measure the height of the foam produced to see how temperature affected the reaction. We did the work, filled a page of our notebooks with messy numbers, and felt like absolute geniuses.
Then came the weekend, and it was time to write the actual lab report.
I sat down at my computer, opened a blank document in Google Docs, and immediately froze. I had no idea how to turn our chicken-scratch data into a formal scientific document. I ended up just writing a long, rambling story of what we did, dumped our raw data into a messy block of text, and called it a day.
When my teacher handed it back covered in red ink, she wrote a note at the top that stayed with me: “An experiment isn’t finished until you communicate your results clearly enough that someone else can replicate your success.”
Writing your first 9th-grade biology lab report can feel like trying to write a legal brief in a language you don’t speak. But once you realize that a lab report is just a highly structured story of an investigation, the intimidation factor disappears. It has a definitive beginning, middle, and end.
Whether you’re a freshman staring at a blank screen trying to figure out where to start, or a parent trying to guide your teenager through their first major science grade, let’s demystify the process. Here is the exact step-by-step blueprint to writing a killer biology lab report without losing your sanity.
The Skeleton: The 6 Core Sections of a Lab Report
Every formal scientific lab report follows a strict structure. Think of these sections like drawers in a filing cabinet. Each drawer holds one specific type of information, and you should never mix them up.
1.The Title & Introduction:Section 1.
State exactly what you are testing and provide the background information. This is where you explain the scientific concepts behind the experiment and state your Hypothesis.
2.Materials and Methods:Section 2.
The recipe section. List every single tool you used and write a step-by-step guide explaining exactly how you performed the experiment.
3.Data and Results:Section 3.
The raw facts. This is where your charts, data tables, and graphs live. You do not explain why things happened here; you just present what did happen.
4.Discussion and Analysis:Section 4.
The brain of the report. This is where you explain the data, connect it back to your biology concepts, and argue whether your hypothesis was right or wrong.
5.Errors and Improvements:Section 5.
The honesty zone. Identify what went wrong, what unexpected variables crept in, and how you would fix the procedure if you did it again.
6.References / Works Cited:Section 6.
Give credit where it’s due. List the textbook pages, lab handouts, or websites you used to find your background scientific facts.
Writing It Out: Step-by-Step Guidance
Let’s walk through how to write each section clearly, using a classic example you’ll likely see in class: measuring how light brightness affects the rate of photosynthesis in an aquatic plant (Elodea).
1. Crafting the Perfect Hypothesis
Your introduction needs to end with a clear, testable prediction called a hypothesis. A lot of students write something vague like, “I think plants will grow faster if they have more light.” That’s too casual.
Instead, use the classic “If… then… because…” formula. It forces you to be specific.
Example of a Strong Hypothesis: If an Elodea plant is placed closer to a light source, then the number of oxygen bubbles produced per minute will increase, because higher light intensity accelerates the light-dependent reactions of photosynthesis.
2. The Materials and Methods Recipe
When writing your procedure, imagine you are writing a cookbook recipe for a beginner chef who has never stepped into a kitchen.
- Rule 1: Use specific measurements. Don’t write “Put some water in a beaker.” Write “Pour 200 mL of distilled water into a 250 mL beaker.”
- Rule 2: Write in the third person, past tense. This is a tough habit to break. Avoid writing “Next, I moved the lamp 10 cm away.” Instead, write “The lamp was moved 10 cm away from the beaker.” It sounds professional and keeps the focus purely on the science.
3. Presenting Data Like a Pro
Your results section should feature a clean data table followed by a graph. If you are tracking a change over time or distance, use a line graph. If you are comparing distinct, separate categories, use a bar graph.
- Always label your axes: Put your independent variable (the thing you changed on purpose, like lamp distance) on the horizontal X-axis. Put your dependent variable (the thing you measured, like bubble count) on the vertical Y-axis.
- Add a descriptive title: Avoid naming your graph “My Graph.” Use a professional format like: “Figure 1: The Effect of Light Distance on Oxygen Bubble Production in Elodea.”
4. The Discussion: Connecting the Dots
This is where most students lose points because they simply repeat their results. Don’t just tell the reader that at 10 cm the plant made 30 bubbles. Explain why it made 30 bubbles using the biology terms you learned in class.
Connect your data points back to your original hypothesis. Use phrases like, “The data supported our hypothesis because…” or “The data failed to support our hypothesis because…”
Real-World Tip: It is completely okay if your hypothesis was wrong! Real scientists prove their predictions wrong every single day. You don’t lose points for a wrong prediction; you lose points for failing to explain why the data didn’t match your expectations.
Common Mistakes That Wreck Lab Report Grades
After reviewing dozens of high school lab reports, I see the same three structural errors derail solid experiments over and over again.
1. Mixing Up Results and Discussion
Keep your facts and opinions completely segregated.
- The Results section is a silent witness: “The temperature rose to 45°C.”
- The Discussion section is the detective: “The temperature rose to 45°C because the chemical breakdown of the hydrogen peroxide released exothermic heat energy.” If you start explaining the science inside your data section, your report becomes confusing to read.
2. Ignoring the Controlled Variables
Students love to list their independent and dependent variables, but they completely forget to mention the constants. If you are testing light intensity on a plant, you have to make sure the water temperature stays exactly the same in every trial, the type of water is identical, and the size of the plant piece doesn’t change. If you don’t list these variables and explain how you controlled them, your experiment loses credibility.
3. Vague Error Analysis
The “Sources of Error” section is not a place to write, “We didn’t make any mistakes” or “My partner misread the stopwatch.” Teachers want to see that you understand the limitations of your tools. Look for actual mechanical or systemic errors. Did the heat from the desk lamp accidentally warm up the water during the close-distance trials? Did some oxygen bubbles get trapped under a leaf where you couldn’t count them? Those are authentic, insightful scientific observations.
Free Digital Tools to Streamline Your Writing
You don’t have to build all of this by hand from scratch. Utilize these excellent free digital platforms to make your reports look professional:
- Google Sheets / Microsoft Excel: Do not try to draw your graphs by hand using the shape tool in Word. Plug your data points into a Google Sheet table, highlight them, and click “Insert Chart.” Choose a clean line graph, customize your axis labels, and paste it straight into your document. It instantly elevates the quality of your report.
- NCES Kids’ Zone “Create a Graph”: If Excel or Google Sheets feels too complicated to navigate, this free online tool is an absolute lifesaver. It walks you through a simple wizard to input your data, pick your colors, and output a pixel-perfect, beautifully labeled graph ready for download.
- Zotero / Google Docs Citation Tool: When you need to cite your biology textbook or an educational website in your references section, use the built-in citation generator in Google Docs (Tools > Citations). It formats your references into perfect MLA or APA style automatically, saving you from formatting headaches.
The Finished Product
Writing a biology lab report can feel tedious when you view it as a massive academic chore. But if you take a step back, it’s really just a roadmap of your own curiosity. By breaking the writing down into distinct segments, keeping your data clean, and being brutally honest about your experimental errors, you aren’t just filling out a school worksheet—you are practicing authentic, real-world communication.
Keep your sections separated, use your “If… then… because…” template for predictions, and approach your analysis like an investigator telling a story. Once you get the rhythm down, your lab reports will practically write themselves.